 |
 |
|
GESS - Exon Skipping EventsA graph-based exon-skipping scanner detection program for RNA-seq data |
|
 |
 |
 |
 |
Back to Laboratory Page
Introduction
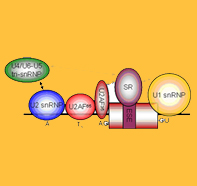
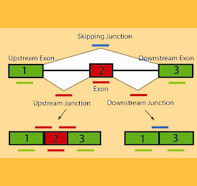
Alternative splicing (AS), in higher eukaryotes, is one of the mechanisms of post-transcriptional regulation that generate multiple transcripts from the same gene. There are numerous modes of alternative splicing, of which the most common is exon skipping event. In this mode, the middle exon in three consecutive exons may be included in mRNA under some conditions or in particular tissues, and excluded from the mRNA in others.
Here, we introduced a novel computational method, graph-based exon-skipping scanner (GESS) detection scheme summarized in Figure 1, to detect de novo exon-skipping events directly from raw RNA-seq data without the prior knowledge of gene annotation information. Firstly, we build a splicing-site-linking graph from the splicing-aware aligned reads using a greedy algorithm, and then iteratively scan this linking graph to obtain those patterns conforming to skipping events. Finally, we apply the MISO model to calculate the ratio of skipping isoform vs. inclusion isoform and determine the dominated isoform.
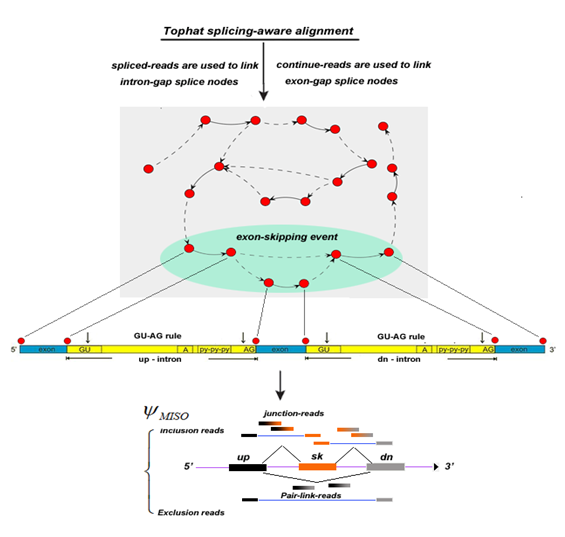
Figure 1: Algorithm scheme of GESS
Given a set of RNA-seq reads either in single-end or pair-end sequences, we first filter out bad reads with low quality and ambiguous bases. We align the remaining reads to the reference genome (either human hg18/19 or mouse mm8/9/10) by TopHat, a splicing-aware reads-mapping tool. After discarding those multiple mapped reads, the remaining set of unique aligned reads are composed of two subsets: 1) a set of aligned splicing-reads in which those reads are split between two genomic locations (presumably the putative exon’s junction), and 2) a set of aligned constitutive-reads in which those reads are restrictively mapped to the same genomic location without splitting two locations (presumably within one exon).
Based on the two subsets of aligned reads, we build a splice-site-link graph to capture the exon-skipping events for a given transcriptome. To determine those splice sites, we examine the set of spliced-reads one by one, assigning the two chromosome positions of a junction revealed byof a spliced-read into two nodes, each corresponding to the potential splice site. We link the two nodes with an edge in a dotted line if a certain number (default parameter is 5) of spliced-reads are above the defined threshold. Since the dotted-line edge corresponds to an intron gap, we are able to determine the direction of the line by examining the ‘GT-AG’ consensus rule for most vertebrate introns. We also calculate the coverage density among these splice sites using the set of constitutive-reads. If there is higher density of reads between two splice sites, we would link the two splice sites (nodes) with an edge in a solid line. This type of edge should correspond to those exonic regions. To assign such a solid-line edge for two nodes, we firstly sort these splice sites along the chromosome coordinates, and calculate the depth of coverage for each segment between the two adjacent splice sites. For each specific segment carrying a robustly higher signal ratio (i.e. 3.0) relative to the flanking background segments, a solid edge is introduced as an exon gap.
Thus, a complex graph would be obtained with intronic or exonic links among the splice sites. We then implement a walking strategy on this graph by iteratively navigating the sub-graphs with pattern that conform to an exon-skipping event. As shown in Figure 1 (the oval shape), for each combination of six connected nodes (splice sites), we would check the pattern which should conform to tri-exons with three solid edges, and the downstream exon would be connected to the upstream exon indicated by the dotted edges; If it is not matched such pattern, we would ignore them and move to next combination. We thus define these confirmed sub-graphs as exon-skipping events, i.e, with two possible combinations: the inclusion combination (termed as inclusion isoform) - inclusion of the middle exon, and the skipping combination (termed as skipping isoform) - exclusion of the middle exon. We finally integrate a MISO model to calculate the ratio of two isoforms and determine which isoform is a dominant event in this cellular condition.
Download
The software is implemented by Python(>=2.7), and can be downloaded from the following link:
GESS-1.0.src.tar.gz
It also require some third party libraries:
pysam https://code.google.com/p/pysam/
scipy http://www.scipy.org/
numpy http://www.numpy.org/
MISO http://genes.mit.edu/burgelab/miso/
To use the software, it's simply to unzip the downloaded file into a directory, and install the above required libraries, then run the following command:
python GESS.py -i K562RNAseq.sorted.bam -g /home/public/hg19 -o GESSOut -n K562 -l 5
note: -i,-g are two mandatory parameters REQUIRED, other parameters please refer -h option. The genome size file and fasta files for each chromosome should be available under the genome directory (for example,here is /home/public/hg19). Here the input bam file must need to be sorted by Samtools or other related tools. After we get the exon-skipping sites, we can use the output from GESS to MISO for Ψ calculation.
The bam file (K562RNAseq.sorted.bam) and index file (K562RNAseq.sorted.bam.bai) can be downloaded from here. It has beed tested on a server with 2 CPUs/32G Memory.
Citation:
Ye Z, Chen Z, Lan X, Hara S, Sunkel B, Huang TH, Elnitski L, Wang Q, Jin VX. Computational analysis reveals a correlation of exon-skipping events with splicing, transcription and epigenetic factors. Nucleic Acids Res. 2014 Mar 1;42(5):2856-69.